Ambitious Instruction and Performance

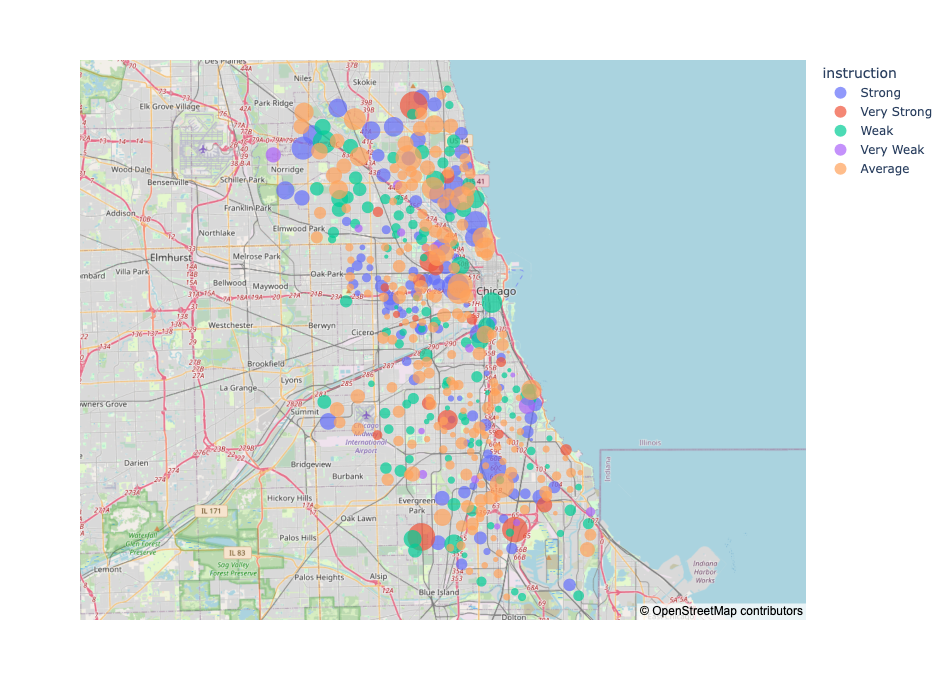
This visualization shows the ambitious instruction scores for different schools throughout Chicago with the size of the data point representing the performance of students. Ambitious instruction is a score given to schools for having classes that are academically demanding and engage students in the application of knowledge. One insight from this visualization is that schools with 'Strong' and 'Very Strong' scores seem to be scattered across the Chicago area. For example, there are many 'Strong' schools to the North of the city; however, there are just as many 'Weak' and 'Average' schools there as well. Another insight from the data is that the ambitious instruction score seems to be related to student performance. Despite some schools with different instruction scores having similar performance values, the visualization shows that schools with higher instruction scores have better performance on average. This makes sense as the students who learn to apply the material are likely to have a greater understanding of it than those who don't. Although there doesn't seem to be any grouping of 'Strong' and 'Very Strong' schools, a third insight from this data is that there seems to be a high concentration of schools directly South of Chicago that have 'Weak' or 'Average' instruction scores.
Attendance by Location

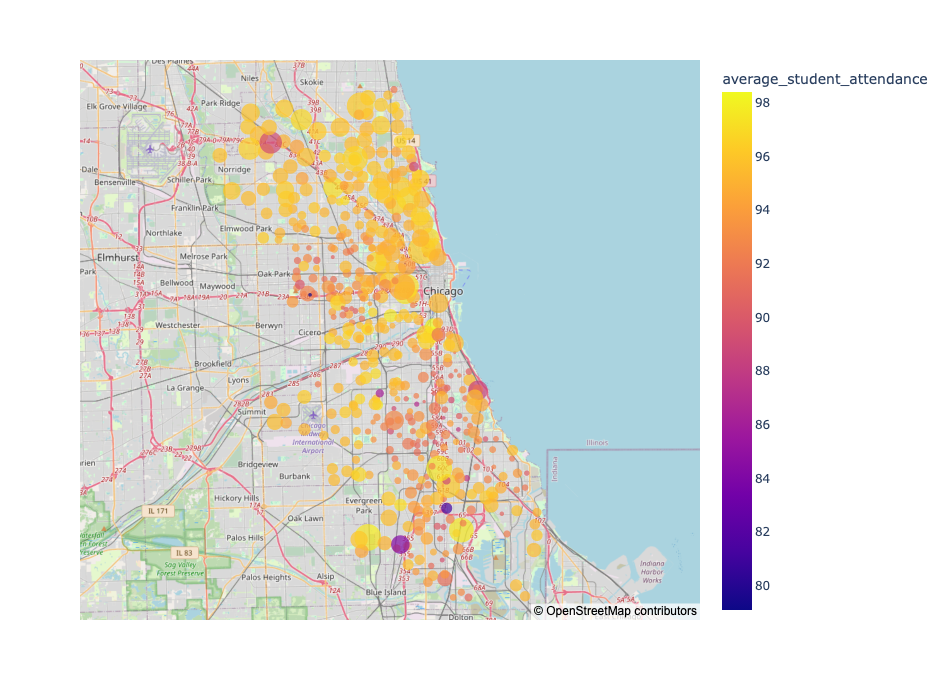
This visualization shows student attendance by location while the size of the data points represents the overall student performance values. One insight from this visualization is that the schools to the North of Chicago's center have better student attendance. These schools also seem to have higher performance values as well based on the size of the data points. Overall, when looking at all of the data in this visualization, we reached our second insight, which is that student attendance appears to be positively related to performance as the schools with higher levels of attendance also tend to have students that perform better. With respect to location, our third insight was focused on schools south of Chicago. These schools are some of the least attended with student attendances in the 88% to 92% range. In addition to this, these schools also have some of the lowest performance values.